Key Statistics & Data
Key Statistics & Data
Increasing risks due to climate-driven wildfires and a lack of adequate insurance rates have resulted in fewer coverage options available to consumers in the voluntary market. As more insurers have declined to provide new coverage or renew existing policies, more Californians have turned to the California FAIR Plan for the basic property coverage they need.
The California FAIR Plan updates the following information on a quarterly basis, unless indicated otherwise. Statistics and data represent the latest available information through March 2026.
The California FAIR Plan Faces Increased Exposure
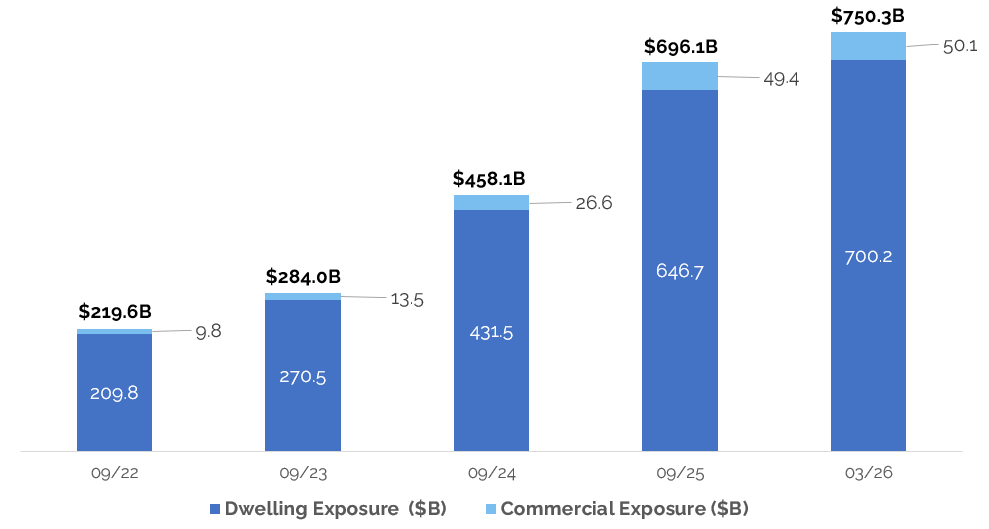
As of March 2026, the FAIR Plan’s total exposure is $750 billion, reflecting an 8% increase since September 2025 (prior fiscal year-end) and a 242% increase since September 2022 (Fiscal Year End 2022).
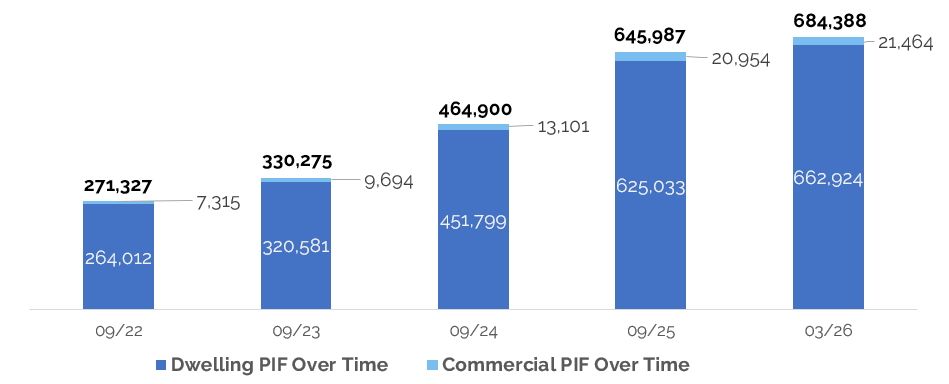
TOTAL DWELLING & COMMERCIAL POLICIES IN FORCE (PIF) HAVE INCREASED
As of March 2026, the FAIR Plan’s total PIF is 684,388 reflecting a 6% increase since September 2025 (prior fiscal year-end) and a 152% increase since September 2022 (Fiscal Year End 2022).
Refer to the links below to access PIF by Line of Business, County and ZIP Code:
View residential + commercial + business owner’s policies in force by county
View residential + commercial + business owner’s policies in force by ZIP code
View residential policies in force by ZIP code
View commercial policies in force by ZIP code
Refer to the links below to access Exposure by Line of Business, County and ZIP Code:
View residential + commercial + business owner’s exposure by county
View residential + commercial + business owner’s exposure by ZIP Code
View residential exposure by ZIP Code
View commercial exposure by ZIP Code
Refer to the links below to access PIF, Premium, and Exposure for Residential and Commercial Policies by Policy Category, Region, ZIP Code, County, wildfire risk score, and Distressed ZIP Code status:
View Residential Policy Count
View Residential Policy Premium
View Residential Policy Exposure
View Commercial (under $20M exposures) Policy Count
View Commercial (under $20M exposures) Policy Premium
View Commercial (under $20M exposures) Policy Exposure
View Commercial (over $20M+ exposures) Policy Count
View Commercial (over $20M+ exposures) Policy Premium
View Commercial (over $20M+ exposures) Policy Exposure
View Reporting Period Changes (2025)
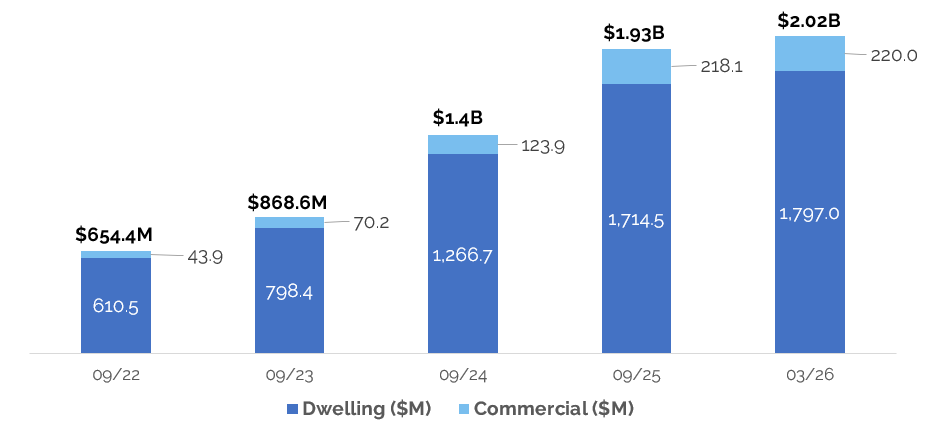
TOTAL DWELLING & COMMERCIAL WRITTEN PREMIUM HAVE INCREASED
As of March 2026, the FAIR Plan’s total Written Premium is $2.02B reflecting a 4% increase since September 2025 (prior fiscal year-end) and a 208% increase since September 2022 (Fiscal Year End 2022).